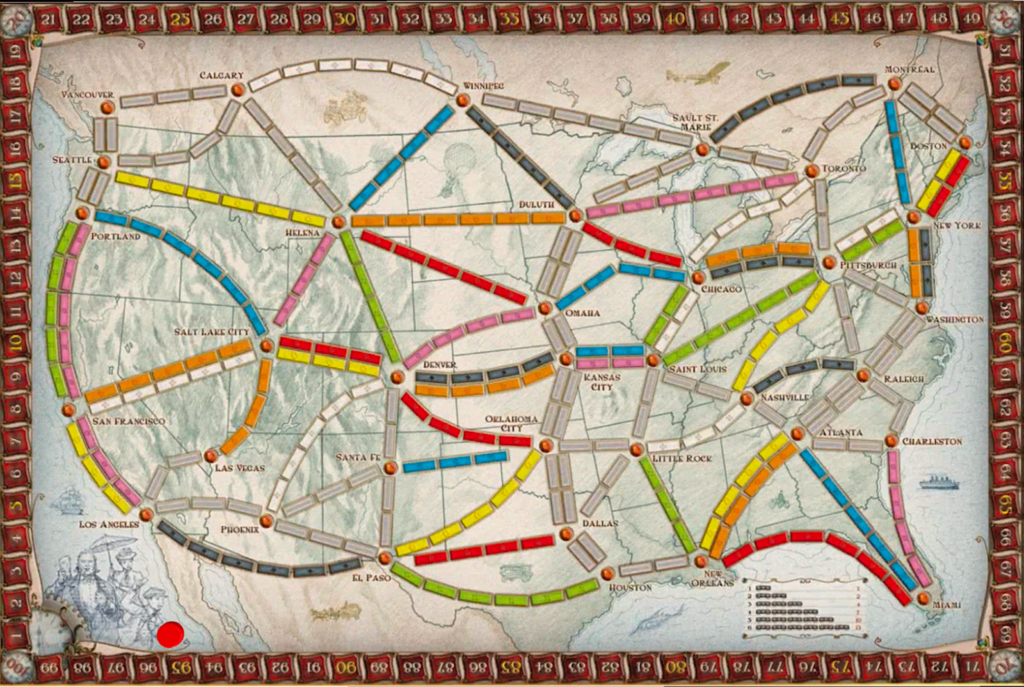
Ticket to Ride is a very popular board game for people who are unfamiliar with more complex board games. Due to its more simplistic nature, although it seems like there are many options in how to place trains on the board, in reality there are some routes that are much more optimal than others.
In a game of Ticket to Ride, the trains placed at the beginning are usually the most important as players generally branch out from where they initially place their trains. Hence, these first twenty to thirty trains are key to success as players pick more tickets later in the game, hoping to find ones that overlap. The different areas of the board players generally place their trains can be split up into seven separate sections: North to South West, North to South central, North to South East, Northwest to Northeast, Northwest to Southeast, Southwest to Northeast, and Southwest to Southeast.
While players often place their trains during this beginning half of the game solely based on their routes, using statistics we can find what route is most optimal. Looking at the thirty destination cards included in the game, 12 of them nicely overlap when going from Southwest to Northeast. In comparison, of the six other possible sections that players can focus on, only 8 overlap with the Central train placement, and all of the other possible routes have even fewer. I counted by checking these tickets to see whether both cities were within one city of the most common route taken by people focusing on that section of the board. Additionally, the total points that the 12 tickets overlapping with the Southwest to Northeast placement score a total of 135, which is much more than the second-highest section, that being Southwest to Southeast with 70 points total on 5 routes.
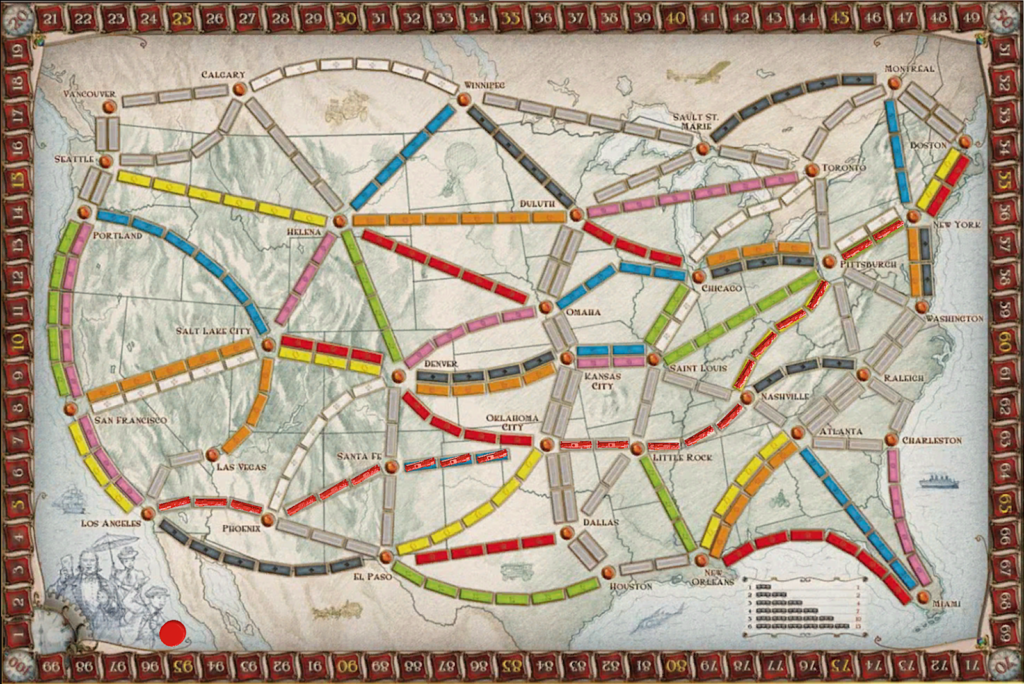
On average, placing along this “optimal route” (seen below), going from Los Angeles to New York can be completed on average in 20.2 turns. This average was calculated using a complex algorithm to have the computer test the time it takes to complete the said route 1,000 times. Additionally, this route takes around 20 trains to complete, which is less than half the number of trains players are given at the beginning of the game.
On this route, although there is only one ticket that is completed directly, the player is more than halfway done with nearly half of the tickets. Since players draw three cards when picking more tickets during the game and must keep only one, going along this path gives the player an 86.2% chance to have one of these nearly completed tickets in their draw. These tickets are also on average worth more points than the average ticket in the game, with the nearly completed tickets averaging to 13.5 points while the overall ticket deck average to 11.6 points. When looking at tickets that are almost completely done, those being the ones that only require three more trains placed on the board after completing the optimal route, there is a 50% chance of drawing one of these tickets when picking tickets during the game, making it more viable to continually pick tickets during the game.
Now, let’s compare these numbers to a different route. If we look at a common route that goes down the eastern side of the board, from Montreal to New Orleans, this route can be completed in 14.8 turns on average, which is 6.4 turns quicker than the optimal route. While this route does complete three tickets on its own, compared to the one ticket that the optimal route completes, the number of tickets that overlap with this route is much lower than that of the optimal route. Only four tickets are more than 50% complete via this route, whereas the optimal route is 50% complete with 14 routes; the four tickets that are nearly completed by this route also average to 9.75 points, much lower than the optimal route’s average. This means that there is only a 36% chance to draw a ticket that overlaps with this route, which makes it much more risky to pick tickets during the game. Since picking many tickets is the most reliable way to win the game, going along the eastern seaboard is much less effective than going southwest to northeast.
For example, if a player receives the ticket Boston to Miami, New York to Atlanta, and Denver to Pittsburgh. At first glance, it may seem like choosing Boston to Miami and New York to Atlanta is the obvious choice, as these two routes heavily overlap. However, it is actually more effective to choose New York to Atlanta and Denver to Pittsburgh, placing trains from Santa Fe to New York along the optimal route and branching to Atlanta and Denver. Although this takes longer than taking Boston to Miami, it overlaps with many more tickets, making it better in the long run.
Of course, this strategy is not without its flaws. If you find tickets that are completely outside of the optimal route, you should probably try to place trains overlapping with those tickets and not follow the optimal route. However, finding less than two tickets that at least have some overlap with this route is unlikely, so this should not be an issue a vast majority of the time. One other major issue is other players. Obviously, it is difficult to simulate where other players place their trains in these calculations, so if other players block off this route, it may become less viable to go along. If other players know that using this is generally quite viable, they will also try to place trains along this route, making it more difficult for you to place trains on this route, so in some cases against more experienced players choosing other routes even when your tickets overlap with the optimal route may be a better choice. Against beginners or even players who have played the game a handful of times, this strategy is often the best for winning games.


