1. Introduction
Commodities are one of the most fundamental and significant categories of market trade and the physical foundation for defining and measuring economic activity. Due to their large quantities, price volatility, sensitivity of market demand and supply, and continuous international trading, the issue of commodity price fluctuations has been of particular concern.
Since the supply and demand of commodities are characterized by certain seasonal variations, i.e. the trend of increase or decrease in the supply or demand of commodities is relatively stable with the change of seasons, the prices of these commodities also exhibit seasonal variations. In the case of grains, typically showcased in a particular season, undergo growth, maturity, and harvest in subsequent seasons, making them more vulnerable to seasonal fluctuations compared to industrial metals or energy. This cycle of growth exposes grains to greater seasonal variability due to their cultivation and harvest timing. Investors in the study of grain price trends, often refer to its seasonal fluctuation pattern.
However, as the financial characteristics of the commodities market have increased in recent years, the stability of the seasonal fluctuation pattern of agricultural commodity prices has weakened. For example, irregular and drastic commodity price changes can take place in unusual circumstances, such as during and after the COVID-19 pandemic. Investors and researchers are expected to be more flexible and meticulous in analyzing the current supply and demand situation when compared to the historical price pattern to adapt to the increasingly complex and volatile market environment.
This paper aims to use time series analysis on the EUR futures price data to focus on the target period of January 2003 to August 2023. We use time series analysis and modeling to analyze seasonal and cyclical trends and later the Autoregressive Integrated Moving Average(ARIMA) model to efficiently and precisely forecast commodities price volatility trends and seasonal cycles. A conclusion will be followed by the analysis to facilitate investors’ and researchers’ subsequent investment and research.
2. Methodology
We use time series plot, time series plot with seasonal trend, decomposition method, and ARIMA model as the main research method for analysis and forecasting in this paper.
The main modeling formula we use is the ARIMA model which can be expressed as:

3. Seasonal and Cyclical Features of Single Commodity Future Price
We select the three most important categories of commodities to subdivide, and then select representative commodity futures prices under each category to study. We want to use the price trends of the subdivided commodities to more intuitively see the characteristics of the different categories, and then analyze the seasonal and cyclical trends under each major category.
3.1 Grains
In this category, we chose the futures price of soybeans as the main data for grains of study for analysis and forecasting. Soybeans are not very risky in futures trading and are suitable for research.
As seen in Figure 3.1.1, soybean futures prices have been more volatile, experiencing three major rises and three major falls over two decades. And in each general trend, there are also smaller fluctuations, showing some cyclical and seasonal characteristics.
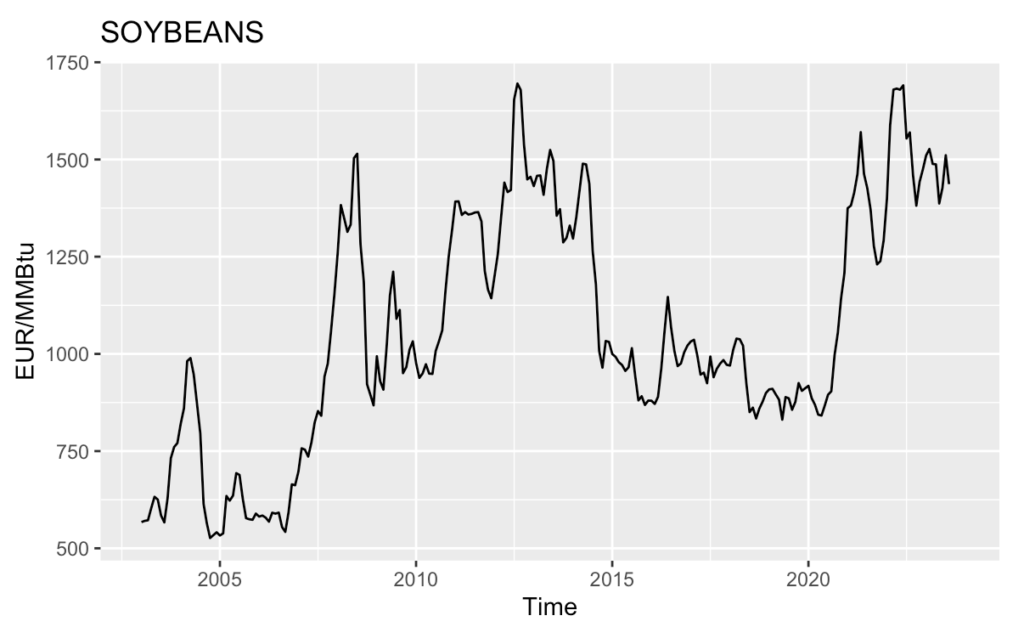
Figure 3.1.1: Soybeans Price Trend Between 2003-2023
From the point of view of the seasonal pattern of soybean planting, soybeans are generally sown in May and June, and enter the harvest period in September. Subject to the cyclical characteristics of soybean growth, the supply and consumption in different months also vary greatly, contributing to the characteristics of seasonal changes in futures prices.
In October each year, the northern hemisphere soybeans are concentrated on the market, resulting in a seasonal supply peak, causing the price to reach the trough. From October to the following February, the price steadily improved mainly because of the gradual slowdown in supply pressure as consumption improved. From February to June, the northern hemisphere soybeans are gradually being consumed, although the harvest of soybeans in South America from the second half of March has nearly begun. This period is also a high consumption period for soybeans, so prices have remained high.
July is a relatively low point, as the arrival of South American soybeans puts real pressure on the price of soybeans in July. On the other hand, with the arrival of summer, palm oil began to peak in consumption, and the substitution of soybean oil began to appear, thus suppressing the demand for soybeans.
As we can see in Figure 3.1.2 from the supply side, in October around the northern hemisphere soybeans concentrated on the supply period of the market impact on the larger, South American soybean listing in July on the price of relatively light degree of impact, corresponding to October and July respectively, the two lows, The price of October is even lower; new soybeans on the market before the supply of a relative shortage of period, corresponding to the relative highs in September and May respectively, the price of May is higher.
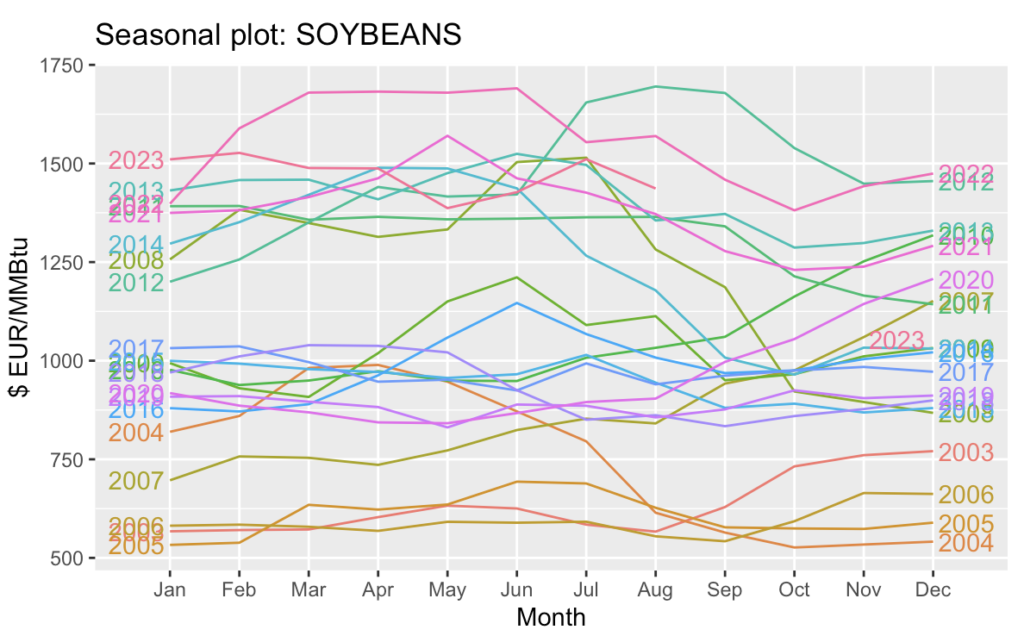
Figure 3.1.2: Soybeans Price Seasonal Trend Between 2003-2023
3.2 Softs
In this category, we focus on sugar, which is used as an essential flavoring in our daily lives. Observation of Figure 3.2.1 shows that sugar price fluctuations are highly cyclical and have a five-year cycle.
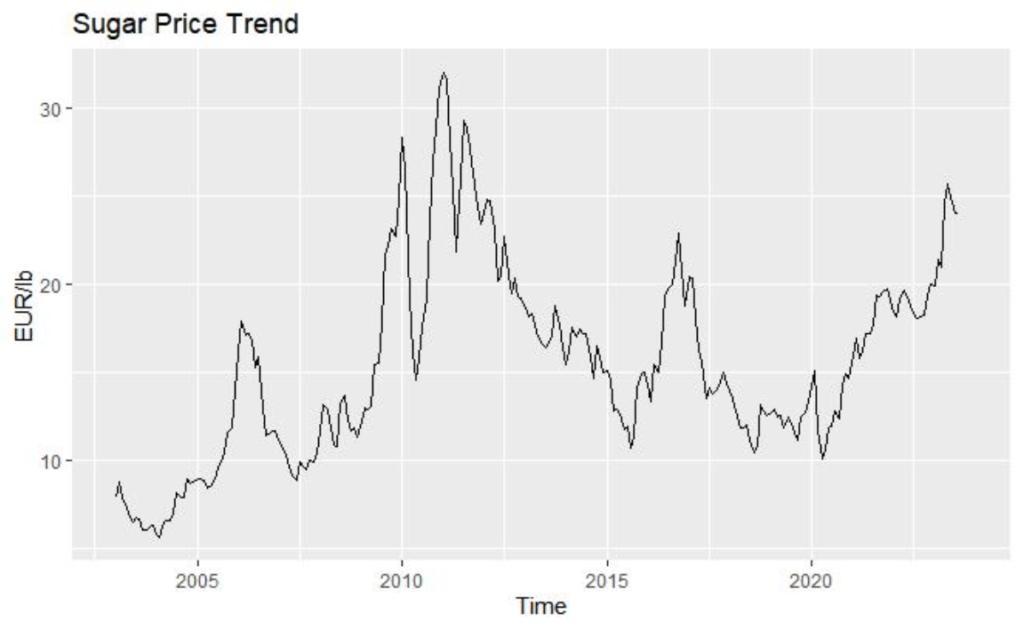
Figure 3.2.1: Sugar Price Trend Between 2003-2023
Studying sugar prices requires a clear understanding of the growth cycle of the sugar crop, which in this case is based on the sugarcane that produces the most sugar, i.e., a sugar cycle that begins in November and ends in April. At the beginning of each cycle, sugar futures prices rise moderately, and in terms of the seasonality of sugar production, the period from September to November each year falls within the relatively weak period of sugar stocks, and there is a clear upward trend in prices at this time.
With the successive start-up of sugar mills after November, sugar supply continues to increase, two months after the start, when the production data is gradually clear, the annual winter demand for sugar also has a gradual growth process. From the futures price point of view, from March to June each year, the price retracement is due to the lack of speculative factors at this time, so the price is in a declining trend (Figure 3.2.2).

Figure 3.2.2: Sugar Price Seasonal Trend Between 2003-2023
3.3 Energy
Natural gas is an energy commodity that is used frequently in daily life, so in this category, we chose natural gas futures prices for our research. Natural gas price trends are also highly cyclical, basically on a 4-year cycle with relatively stable periods, as shown in Figure 3.3.1.
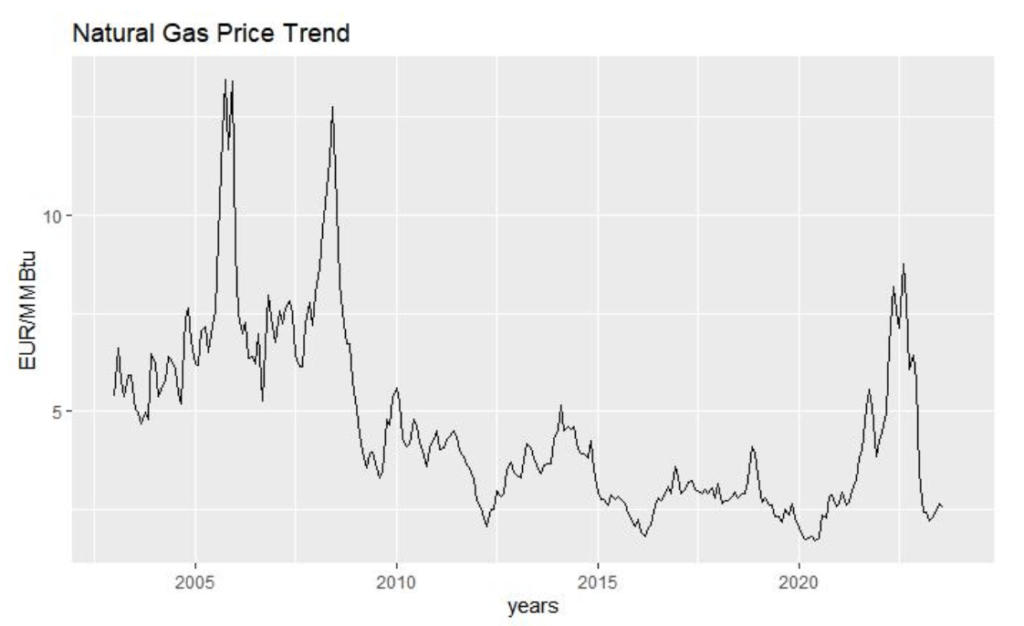
Figure 3.3.1: Natural Gas Price Trend Between 2003-2023
During the winter months, increased residential and commercial heating use leads to a significant rise in natural gas demand. In the summer, natural gas use is much lower due to air conditioning and cooling needs. Other factors may also affect the demand for natural gas, including climate change and the price of other fuels such as coal and fuel oil.
Seasonality can be seen in Figure 3.3.2. Prices reach their highest level between late October and mid-December before entering the winter season, and after a season of heavy consumption, storage reaches its lowest level at the end of the winter season, which, together with lower demand, causes prices to fall. Natural gas production volumes have been relatively stable, and in recent years seasonality has become less influential on production variations than in previous years.
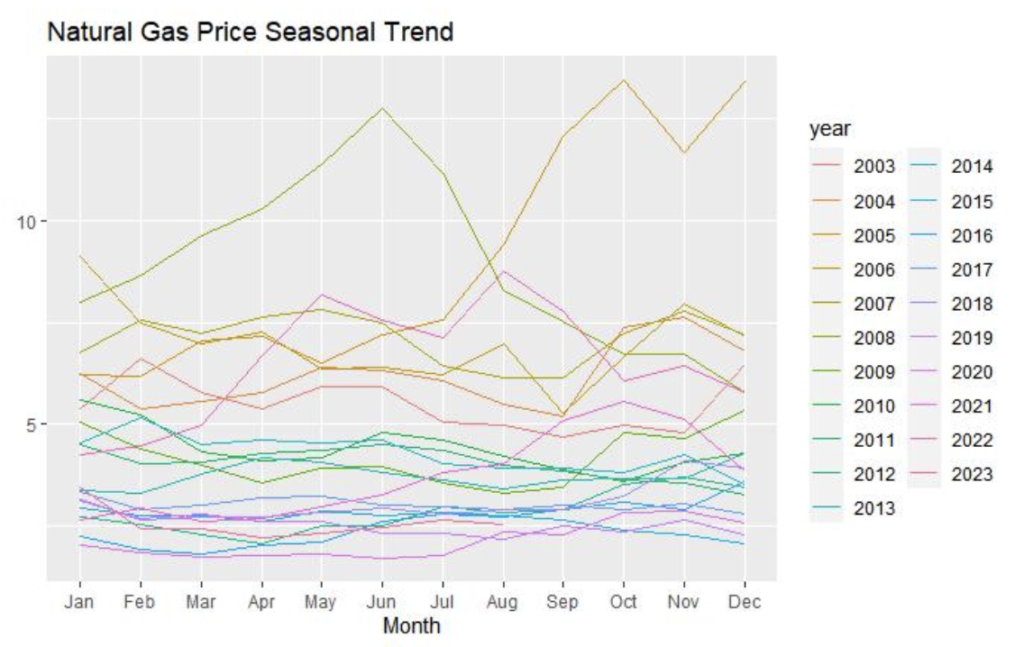
Figure 3.3.2: Natural Gas Price Seasonal Trend Between 2003-2023
4. Analyzing and Forecasting Price Trends for Various Commodities using ARIMA model
We will investigate and forecast the price trends for the three major classifications of commodities using the selected data from the period of January 2003 to August 2023.
4.1 Grains Forecasting
Firstly, if we look at the trend of soybean (Figure 4.1.1), we can see that the period of fluctuation is gradually lengthening, from a 3-4 year cycle to a 9-10 year cycle. If the weight of the impact of COVID-19 is adjusted to a minimum, the third cycle in the graph becomes 7-8 years, because the interval between the first two cycles is stable. The certainty of the Arima model’s analysis of soybean price trends is not particularly assured, with a large dispersion in the range of forecasts, representing a high level of trend variability in recent years. This means that grains are a type of commodity with relatively fixed cycles and a lot of price volatility.
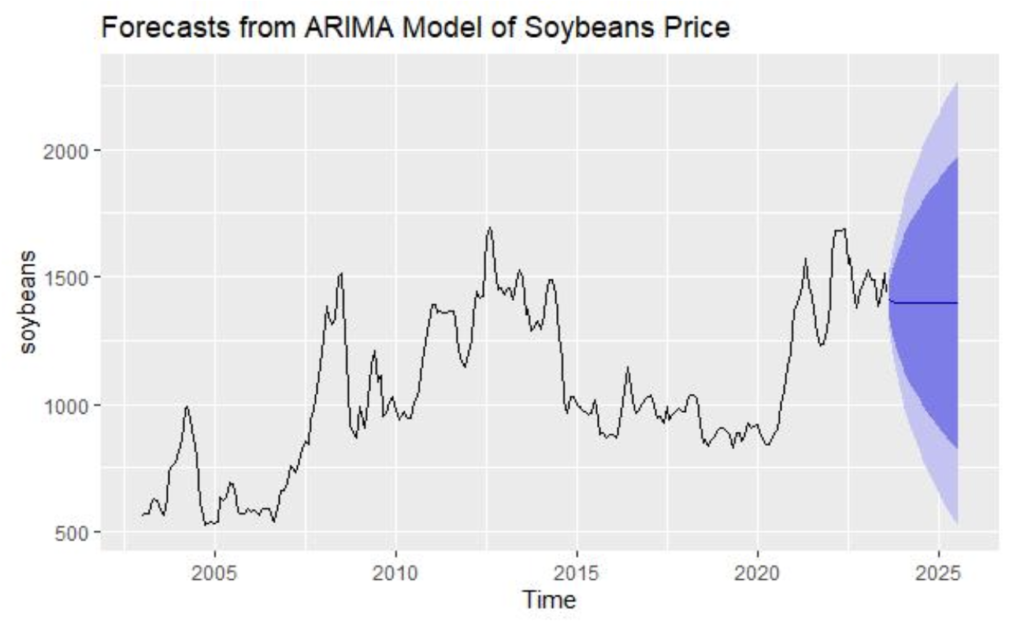
Figure 4.1.1: Forecasts from ARIMA Model of Soybeans Price
4.2 Energy Forecasting
Figure 4.1.2 below shows the ARIMA model’s price trend forecast for natural gas. It can be seen that natural gas is on a 2-3 year cycle and as previously analyzed natural gas has a clear seasonal trend. Therefore, the accuracy of the ARIMA model’s prediction for natural gas is much higher than several other commodities. In other words, energy commodities have stronger cyclical and seasonal trends and a higher probability of prediction than other commodities, which means that these commodities are more suitable for traders to engage in trade activities.
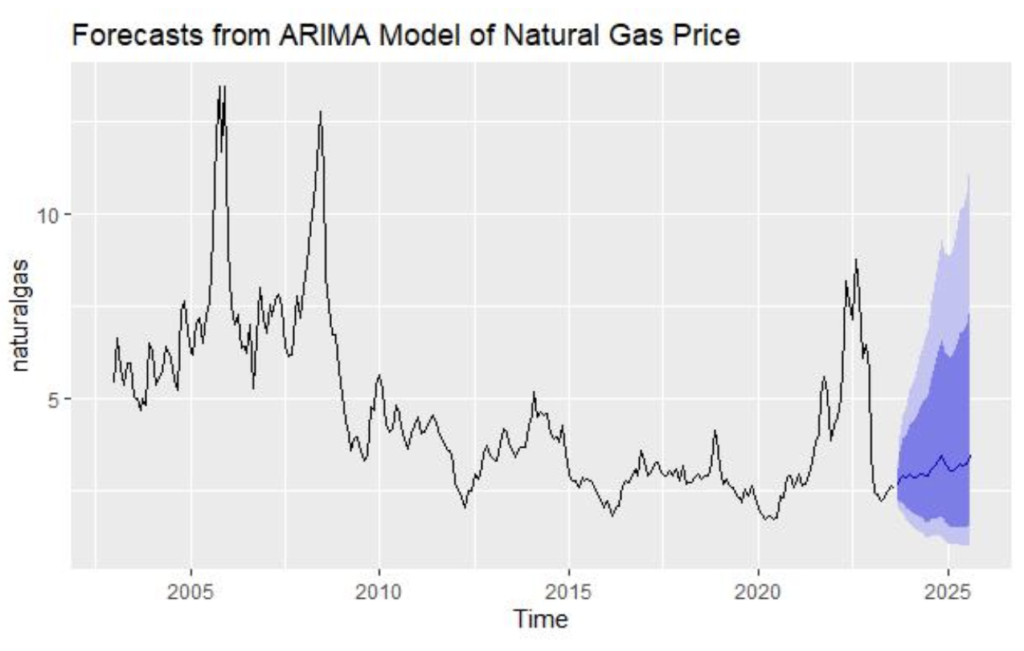
Figure 4.2.1: Forecasts from ARIMA Model of Natural Gas Price
4.3 Softs Forecasting
The last category we study and analyze is the price trend of softs, represented by sugar. As shown in Figure 4.3.1, the price trend for sugar is cyclical through adjacent short and long cycles and the price fluctuations around the mean are not considered significant. Although this type of commodity cycle is well determined, after the outbreak of COVID-19 with the increase in sugar crops, we are not good at predicting the range of peaks in the next cycle and taking these factors into account, so the ARIMA model gives a wider range of predictions.
The point at which softs are difficult to predict compared to the other three types of commodities is that there is not as much production and storage even though there is a high degree of certainty about supply and demand. However, the opportunity for speculation is small and investors prefer to invest in other types of commodities that are more fluctuating and well-predicted.
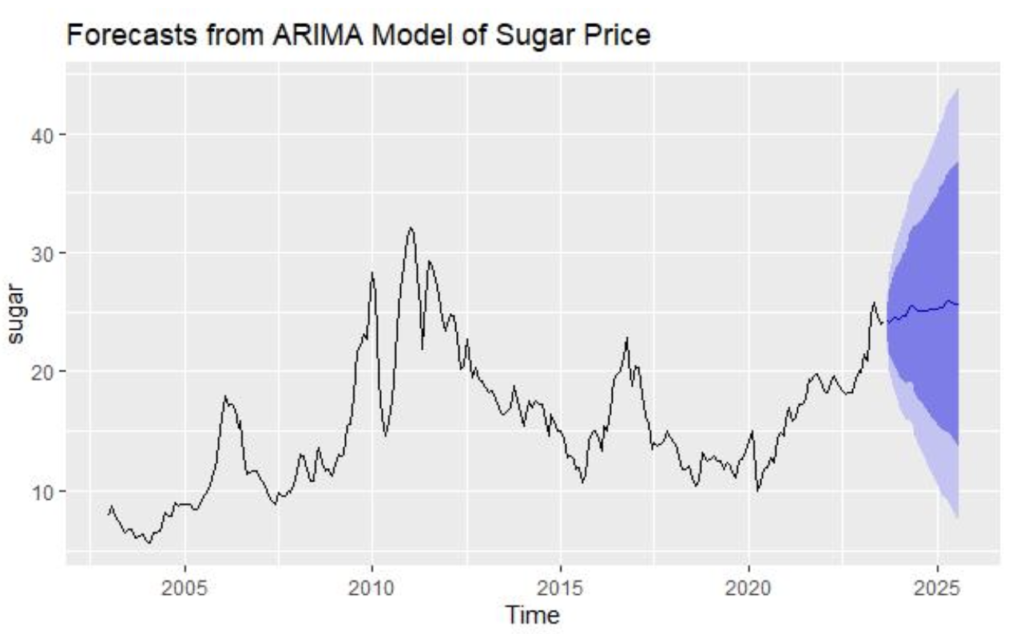
Figure 4.3.1: Forecasts from ARIMA Model of Sugar Price
5. Conclusion
In this paper, we focus on futures price trends for commodities based on R. We analyzed the price trend scenario of different types of commodities in detail from three perspectives to make a prudent forecast for the future period of commodities.
From analyzing seasonal and cyclical trends in a single commodity, we can see the characteristics of each type of commodity. Among the different categories of commodities, each type has different sensitivities to supply and demand, seasons, and storage. Some energy commodities are more predictable and less volatile than the other two and are relatively stable. Grains, on the other hand, are more volatile, with significant price variations between seasons, with maximum and minimum spreads of up to 200%. The intermediate type is softs, which have seasonal trends but are subject to production and limited supply and demand, with small spreads and insignificant cycles. Investors who prefer to invest in volatile, high-risk products probability can invest in grains, and must pay attention to risk control with no counter-cyclical investment; and investors who want to invest in futures but do not want to take too much risk can invest in energy commodities safety varieties, but be cautious to invest in more volatile palm oil, crude oil, etc.
6. References
Brooks, C., Prokopczuk, M. and Wu, Y. (2013). Commodity futures prices: More evidence on forecast power, risk premia and the theory of storage. The Quarterly Review of Economics and Finance, 53(1), pp.73–85. doi:https://doi.org/10.1016/j.qref.2013.01.003.
Debashish Maitra, D. (2018). Do seasonality, break and spillover effects explain commodity price volatility: Evidence from the Indian commodity markets. [online] Emerand insight. https://www.emerald.com/insight/content/doi/10.1108/JADEE-04-2015-0019/full/html.
Ewald, C.-O., Haugom, E., Lien, G., Størdal, S. and Wu, Y. (2022). Trading time seasonality in commodity futures: An opportunity for arbitrage in the natural gas and crude oil markets? Energy Economics, [online] 115, p.106324. doi:https://doi.org/10.1016/j.eneco.2022.106324.
Fama, E.F. and French, K.R. (2015). Commodity Futures Prices: Some Evidence on Forecast Power, Premiums, and the Theory of Storage. The World Scientific Handbook of Futures Markets, pp.79–102. doi:https://doi.org/10.1142/9789814566926_0004.
Figueiredo, M. and Saporito, Y.F. (2022). Forecasting the term structure of commodities future prices using machine learning. Digital Finance. doi:https://doi.org/10.1007/s42521-022-00069-3.
Hevia, C., Petrella, I. and Sola, M. (2018). Risk premia and seasonality in commodity futures. Journal of Applied Econometrics, 33(6), pp.853–873. doi:https://doi.org/10.1002/jae.2631.
Richter, M.C. and Sørensen, C. (2002). Stochastic Volatility and Seasonality in Commodity Futures and Options: The Case of Soybeans. [online] papers.ssrn.com. https://papers.ssrn.com/sol3/papers.cfm?abstract_id=301994.
Sørensen, C. (2002). Modeling seasonality in agricultural commodity futures. Journal of Futures Markets, 22(5), pp.393–426. doi:https://doi.org/10.1002/fut.10017.
Todorova, M.I. (2004). Modeling Energy Commodity Futures. The Journal of Alternative Investments, 7(2), pp.10–32. doi:https://doi.org/10.3905/jai.2004.439638.

